Practical session on Clustering methods

0. Preliminary configuration

1. Comparison of main classical clustering algorithms

  1. Inside R environment, place yourself into your local copy of the "examples" directory:
    • setwd("examples")


  2. Load into R the 5 data files Atom, Lsun, WingNut, Chainlink, TwoDiamonds (visualized above):
    • tmp = read.table("xxx.lrn", comment.char = "%")  # where xxx must successivement be set as: Atom Lsun WingNut Chainlink et TwoDiamonds 
    • true_data_xxx =tmp[,-1]

  3. Experiment the K-means algorithm on these 5 different datasets:
    • km_xxx = kmeans(true_data_xxx,K)  # where K is the desired number of clusters (to be manually chosen by you !) into which data shall be partuitionned
    • plot(true_data_xxx,col=km_xxx$cluster)
    QUESTION 1: Does the K-means algo always produce the expected result?
    By analyzing and comparing the SHAPES of clusters in the datasets on which K-measn works best and worse, try to understand for which type of point distribution K-means is NOT well-suited. You can confirm this by relaunching K-means with increasing values for K on datasets over which it produces bad results, and checking the shapes of produced clusters.
    QUESTION 2: What is the only shape of cluster that K-means is capable of isolating?

  4. Now, experiment with the Hierarchical Agglomerative Clustering (HAC) methods (hclust function):
    dist2_xxx=dist(true_data_xxx)
    hs_xxx=hclust(dist2_xxx,method="single")
    plot(hs_xxx) # For visualizing the DENDROGRAM
    labS_xxx=cutree(hs_xxx,K) # K = number of desired clusters, which shall determine the height at which the dendrogram will be cut
    plot(true_data_xxx,col=labS_xxx)

    hc_xxx=hclust(dist2_xxx,method="complete")
    plot(hc_xxx) # To visualize the DENDROGRAM 
    labC_xxx=cutree(hc_xxx,K) # K = number of desired clusters, which shall determine the height at which the dendrogram will be cut
    plot(true_data_xxx,col=labC_xxx)

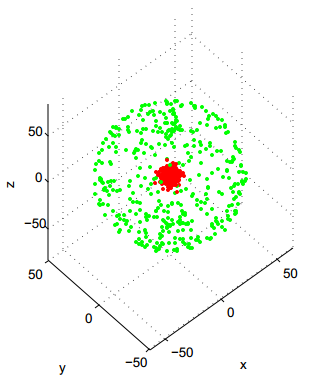
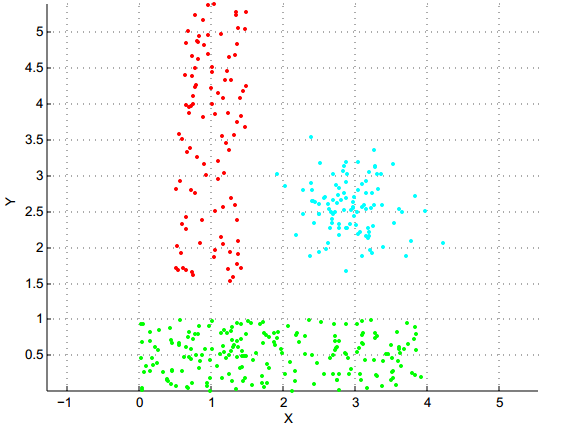
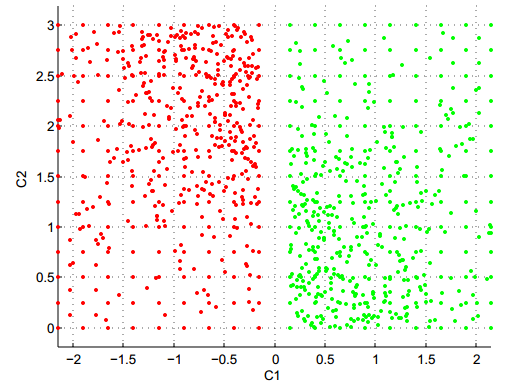
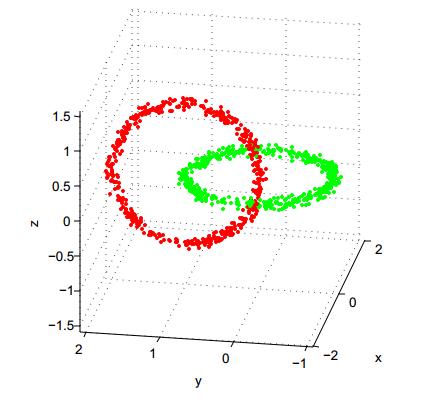
    QUESTION 3: On which dataset does "single-linkage" HAC produce an excellent result? Why is it logical?
    QUESTION 4: Conversely, on which dataset does "single-linkage" HAC perform very badly, and why is it expected?
    QUESTION 5: By comparing with what you had observed for K-means, which variant of HAC (between single-linkage and complete-linkage) seems to be the most complementary to K-means?


  5. Finally, experiment spectral clustering (specc function, accessible after having executed the "library(kernlab)" command in R):
    • library(kernlab)
    • sc_xxx_K = specc(true_data_xxx, centers=K)     # where K is the desired number of clusters
    • plot(true_data_xxx, col=sc_xxx_K)
    • help(specc)     # To get complete help on all possible parameters of the function

  6. Optionnally, you can also experiment the above clustering methods on other datasets included in the "examples" directory.